
Zepbound® Half Life Chart for Your Weekly Shots
Watch Each Weekly Zepbound® Shot Build and Taper
Enter the day of each recent Zepbound® shot and the amount on your prescription label, and the chart draws how much may remain each day. The Zepbound® FDA label gives a half-life of about 5 to 6 days, so the chart shows that range as a shaded band rather than a single line. Everything is calculated on your device, with no account and nothing sent to Pep AI. It is an estimate for learning, never a dosing or timing recommendation.
Half-life about 5 to 6 days (Zepbound® label), drawn as a band. On the chart, each shot peaks about 36 hours after it is taken.
Your doses
Day of each shot (day 1 is your first entry) and the amount. Use your own unit; the chart is relative, so the shape is what matters.
Calculated on your device. Nothing you enter is stored, added to the web address or sent to Pep AI.
Estimated peak
At the end of the chart
Shaded band: the label's half-life range. Solid top edge, 6 days half-life; dashed bottom edge, 5 days. Thin dashed lines mark shot days.
Doses plotted
4
Longest gap between doses
7 days
Below 10% of peak
18 to 22 days after last dose
An estimate only, not a lab value and not dosing advice. Zepbound® is a trademark of Eli Lilly; Pep AI is not affiliated with or endorsed by Eli Lilly.
The default rows are relative amounts of 1, so the chart shows a shape, not a real dose. Replace them with your own shots.
How Long Zepbound® Stays in Your System
In short: a 5 to 6 day half-life, a median peak 24 hours after a shot and steady state after about 4 weeks (label facts), and mostly cleared about 25 to 30 days after the peak (the five half-lives rule of thumb, not a label figure).
Half-Life: About 5 to 6 Days
Label fact. Zepbound® contains tirzepatide, and its FDA label (revised August 2026) gives an elimination half-life of approximately 5 to 6 days in people with overweight or obesity. On this chart, roughly half of a shot remains five to six days after its peak.
That is why the chart uses a band instead of one line. The band shows the label's 5 to 6 day range; your own curve can sit outside it.
Peak: About 24 Hours After a Shot
Label fact. The Zepbound® label gives a median time to maximum concentration of 24 hours, with a range of 8 to 72 hours. The chart's curve peaks about 36 hours after each shot, inside the label's 8 to 72 hour range.
The 24 hour figure is a median from the label, not your personal timing. Your own peak can come earlier or later.
Steady State: About 4 Weeks
Label fact. The label says steady-state tirzepatide levels were reached after 4 weeks of once-weekly dosing. Before that point, the chart climbs a little with each weekly shot.
After it, each week draws a similar wave. That wave is the shape most people picture when they look up this chart.
Mostly Cleared in About 25 to 30 Days
Rule of thumb. The Zepbound® label does not give a separate clearance time, but a general rule is that a medicine is mostly gone after about five half-lives. With a 5 to 6 day half-life, that works out to about 25 to 30 days after the peak.
Treat that as a rule of thumb, not a personal timeline. Your prescriber can tell you what it means for you.
Source: Zepbound® prescribing information, revised August 2026.
How to Read Your Chart
Sample chart: five weekly Zepbound® shots of a relative amount of 1, then the tail after the last one. Solid top edge: 6 day half-life. Dashed bottom edge: 5 days. Thin dashed lines: shot days. The chart shows math, not symptoms or effects.
The Shaded Band
The top edge of the band uses a 6 day half-life and the bottom edge uses 5 days. The wider the band gets, the more the small difference in half-life adds up over time.
Neither edge is your personal level. Both are estimates drawn from the label range.
Shot-Day Markers and Peaks
Each Zepbound® shot shows as a marker on the day line, and the curve rises to its estimated peak about 36 hours later. The curve then eases until the next shot.
The lowest point each week sits just before the next shot. The next shot starts a new rise.
The First Four Weeks
For a new routine, each weekly peak sits a little higher than the last because part of the previous shot is still present. Around week 4, the peaks level out into a steady wave.
Step-Ups and a Final Shot
When your prescriber moves you to a higher Zepbound® dose, enter the new amount from that day and the chart shows a new baseline forming. A final shot shows as a long, easing tail that reaches close to zero after about a month.
Your step-up plan comes from your label and your prescriber. The chart only draws what you enter.
How the Chart Is Drawn
Formula: each shot rises to an estimated peak about 36 hours after it is taken. After the peak, what is left is the amount entered × 0.5 ^ (days since the peak ÷ half-life), with one band edge at 5 days and one at 6 days. Worked example with an amount of 1, as Pep AI's calculators use: at the peak, 36 hours after the shot, both band edges are at 1. One week after the peak about 0.38 remains at the 5 day edge (1 × 0.5 ^ (7 ÷ 5)) and about 0.45 at the 6 day edge (1 × 0.5 ^ (7 ÷ 6)).
| Weeks after the peak | 5 day edge | 6 day edge |
|---|---|---|
| 1 | 38% | 45% |
| 2 | 14% | 20% |
| 3 | 5% | 9% |
| 4 | 2% | 4% |
| 5 | 1% | 2% |
One Formula Per Shot
Each shot rises to an estimated peak about 36 hours after it is taken, then halves every 5 to 6 days (one band edge at 5 days, one at 6 days). After the peak, what is left is the amount entered × 0.5 ^ (days since the peak ÷ half-life). The estimate adds up what is left from every shot on the list.
After the peak, a phone calculator can check any point on the chart. Nothing about the method is hidden.
One Shot, Week by Week
Counting the weeks from the peak, not from the shot: 1 week after the peak, about 38% to 45% remains, and 2 weeks after the peak about 14% to 20%. By 4 weeks after the peak, only about 2% to 4% of that shot is left.
The table above lists each week, so the taper is easy to read at a glance. It works the same way whatever amount is entered.
What to Enter
Enter the day you took each Zepbound® shot (day 1 is the first one you enter) and the amount printed on your prescription label. A few weeks of real shots give a more realistic chart.
Leave out anything you are unsure about rather than guessing. The chart is only as good as what is entered.
Your Entries Stay on Your Device
Every calculation runs in your browser. Days and amounts are never added to the web address, stored or sent to Pep AI.
Close the tab and the entries are gone. There is no sign-up and no email required.
Last updated November 2026. Half-life range from the Zepbound® prescribing information, revised August 2026.
What the Chart Can and Cannot Tell You
It Is Not a Blood Test
The chart shows an estimated amount remaining, built only from the days and amounts entered. It is not a measured level in your blood. Absorption, body weight and other factors vary from person to person, and the chart does not model them.
It Never Suggests a Dose or a Time
This page never recommends a dose, a dose change or the timing of your next shot. Those decisions belong with your prescriber. If a Zepbound® shot was late or missed, check your label and contact your prescriber or pharmacist.
It Uses the Label's Own Range
The 5 to 6 day half-life comes from the Zepbound® prescribing information, and the source is listed on this page. The label revision used, August 2026, is named next to the source.
The Zepbound® label carries a boxed warning about the risk of thyroid C-cell tumors. Read it, and the rest of the label, with your prescriber. Zepbound® is a trademark of Eli Lilly, and Pep AI is not affiliated with or endorsed by Eli Lilly. Read the Zepbound® FDA label.
Get a Live Chart From Every Shot You Log
Every Shot on Its Weekly Schedule
Pep AI logs each Zepbound® shot with its weekly schedule, timing and history in one place. Your step-ups are entered once, exactly as your prescriber set them.
Pep AI never suggests a dose. It keeps the record so you do not have to remember it.
The Estimated Level Updates Itself
Inside Pep AI, the estimated level chart is drawn from the shots you actually log. The Dose tab shows whether it is rising or easing off, and it updates every time a shot is logged, with nothing to retype. It is an estimate, not a lab value.
Injection Sites on a Body Map
Pep AI records where each shot went on an interactive body map. The map marks your last site, lists your recent sites and warns you if you pick the same spot again, which also makes a sore spot easy to mention at your next appointment.
One App Instead of Five
Shots, meals, side effects and progress are all logged in Pep AI, each with its own history, so you don't need a notes app, a calendar reminder and a spreadsheet.
Everything about your week is in one app when a question comes up. Nothing has to be pieced together from memory.
See Progress and Side Effects Alongside Your Shots
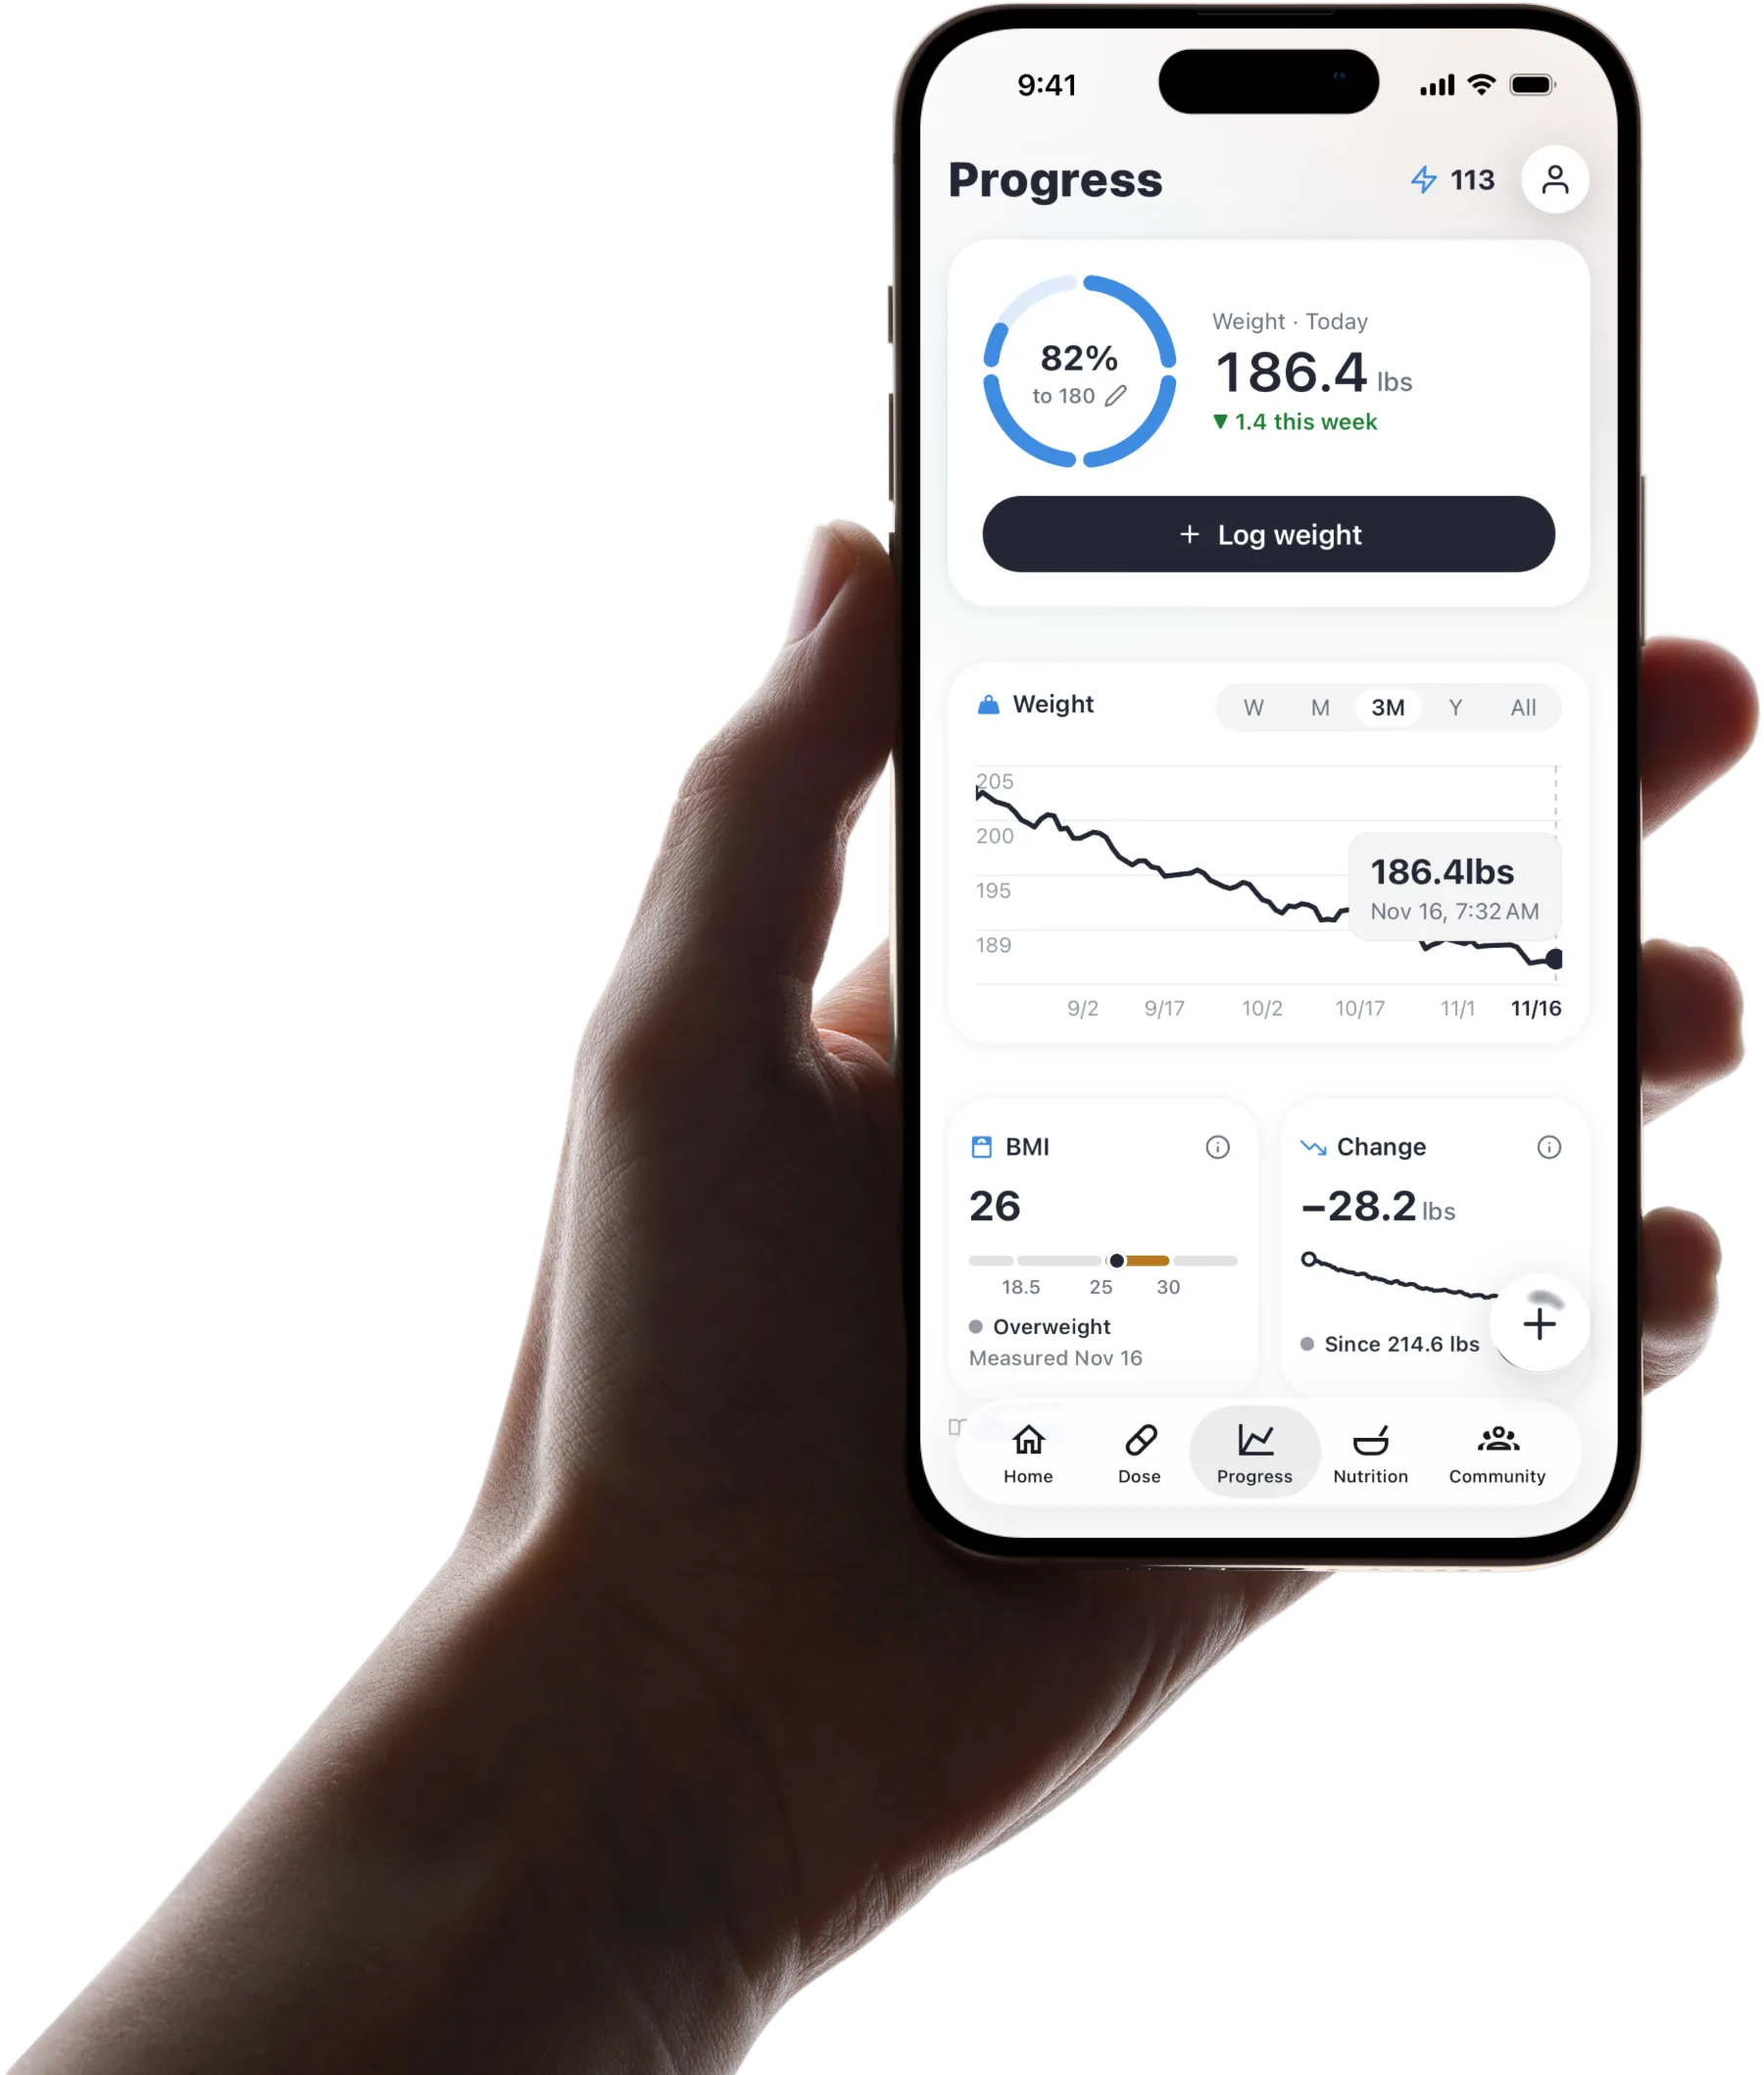 The weight trend in Pep AI, on its own screen next to your dose history.
Weight Trend Over Weeks, Not Days
Daily weigh-ins move around, so Pep AI shows the trend line next to progress photos and daily check-ins. Weight and steps can sync with Apple Health, and Health Connect works on Android.
Achievements mark consistency milestones along the way. Progress shows up as a trend, not a single number on a hard morning.
Symptoms Rated by Severity
Pep AI has a built-in list of GLP-1 symptoms grouped by body area, plus any you add yourself, each rated for severity on the day it happened. With your shots logged in the same app, a pattern a day or two after shot day is easier to check.
Bring that pattern to your prescriber, who can tell you what it means for you. Pep AI only shows the record.
Reminders Where You Look
Pep AI sends a shot-day reminder at the time you choose, and tapping it opens the log for that shot. On iPhone, a Live Activity on the Lock Screen counts down to your next Zepbound® shot with a one-tap Log button, the large Next Dose widget has a Log button too (iOS 17 or later), and the Apple Watch app can log a shot from your wrist. Widgets and the Apple Watch app are iPhone only.
In One User's Words
“Keeping me in track on my weight loss journey!” That is how one Pep AI user summed it up in an App Store review.
Sources
Frequently asked questions
Track this automatically with Pep AI.
Pep AI draws an estimated level chart from every Zepbound® shot you log and keeps your weight trend and side effects in the same app. It is free to try with a free download and a 3-day free trial, then a subscription.


This tool is for general information and education only and is not medical advice. It does not recommend a dose or a schedule. Talk to your prescriber about your medication and any change to it.
Built by the Pep AI team.